- Recent Bitcoin on-chain figures have pointed to a potential market peak, with a cycle peak similar to previous years.
- Analysts saw an increase in sales activity, in line with historical trends.
Bitcoin [BTC] was down at the time of writing, erasing its previous rally above $63,000.
Over the past week, the cryptocurrency has dropped by 1.1%, with an even larger drop of 2.7% in the last 24 hours alone, sending its trading price down to $60,929.
Amid these market movements, Charles Edwards, the founder of Capriole Investments, indicated that various on-chain statistics point to a possible weakening of Bitcoin’s market position.
The turning point for Bitcoin?
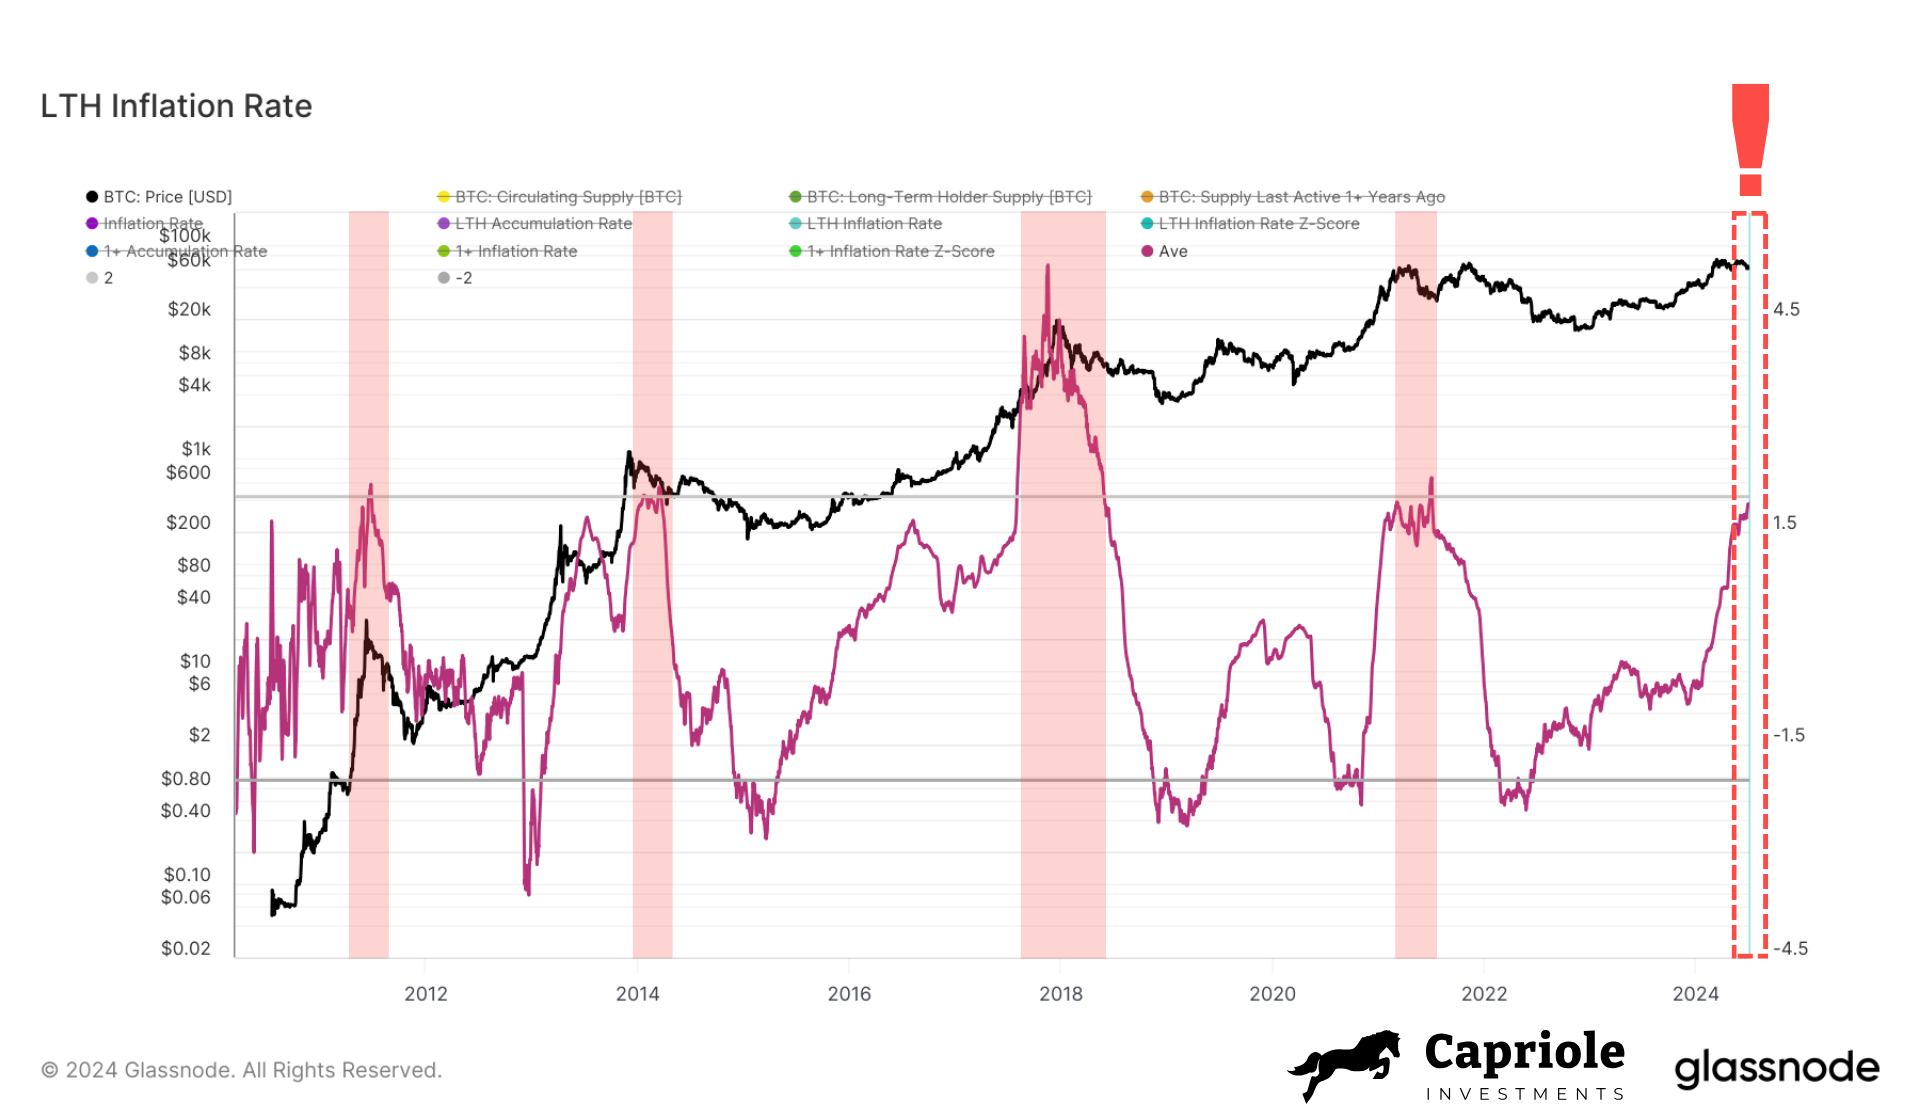
Charles Edwards pointed to several on-chain indicators as potential indicators of market exhaustion.One important sign is the behavior of Bitcoin’s Long-Term Holder (LTH) inflation rate, which Glassnode monitors.

Source: Capriole Investments
The LTH inflation rate, which measures the annual rate at which long-term holders sell their Bitcoin relative to the number of new coins mined, has shown a sustained increase over the past two years.
Currently, it is hovering around a critical point historically associated with market tops. Edwards noted that LTH market inflation approaching the 2.0 nominal inflation rate often signals a cyclical peak.
At the time of going to press, the King’s coin was dangerously close to 1.9.
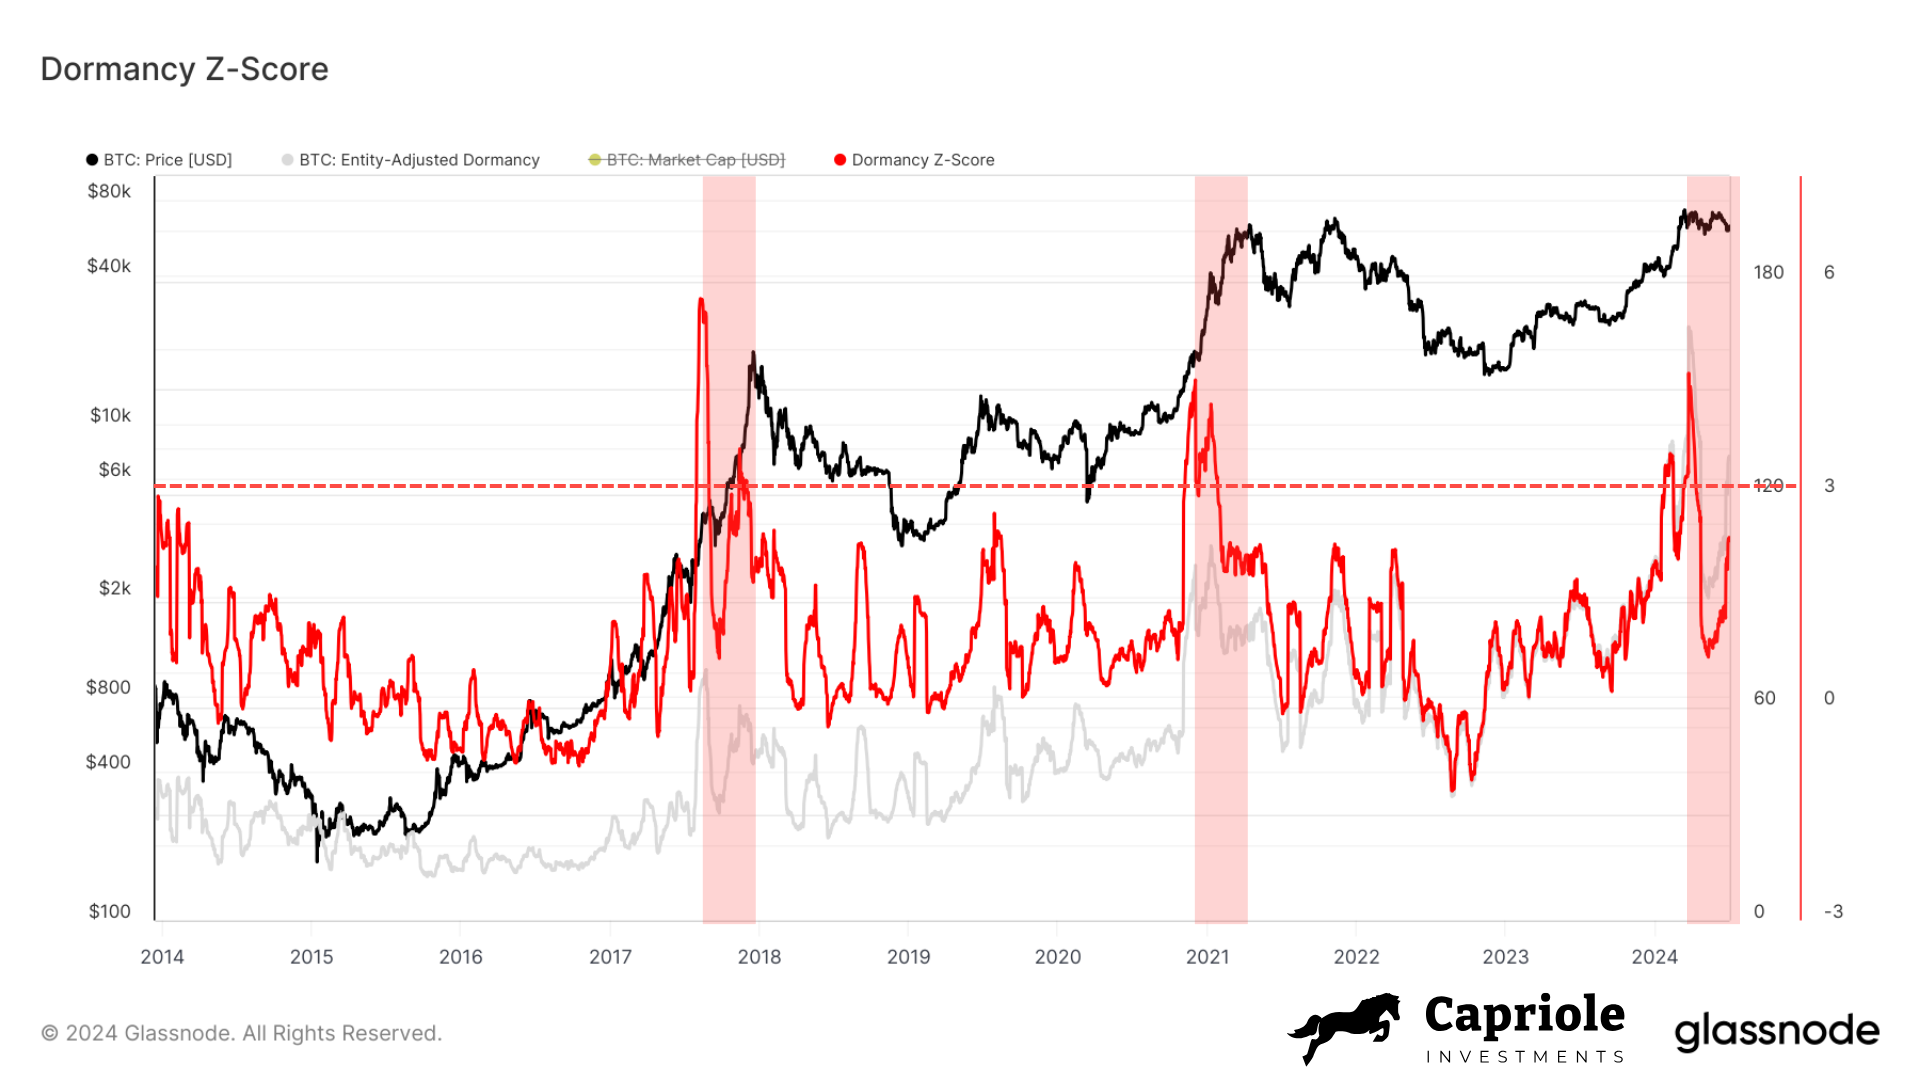
Another key metric Edwards discussed was the Dormancy Flow, which evaluates the value of issued coins relative to their age and total transaction volume.
Recent data shows that the Dormancy Z-score has increased sharply, particularly in April 2024. This could indicate that older coins are moving at a rate that points to a cyclical peak.


Source: Capriole Investments
Edwards explained:
“Peaks in this metric (z-score) typically see cycle tops just three months later. Well, it’s three months later now. Price has only fallen and the Dormancy Z-Score peak remains with a structure very similar to the 2017 and 2021 tops.”
The Dormancy Flow Z-score at the time of writing suggested that Bitcoin’s price may have peaked for this cycle, as the price appeared overvalued based on the transaction volumes of older coins, potentially signaling a general market downturn.
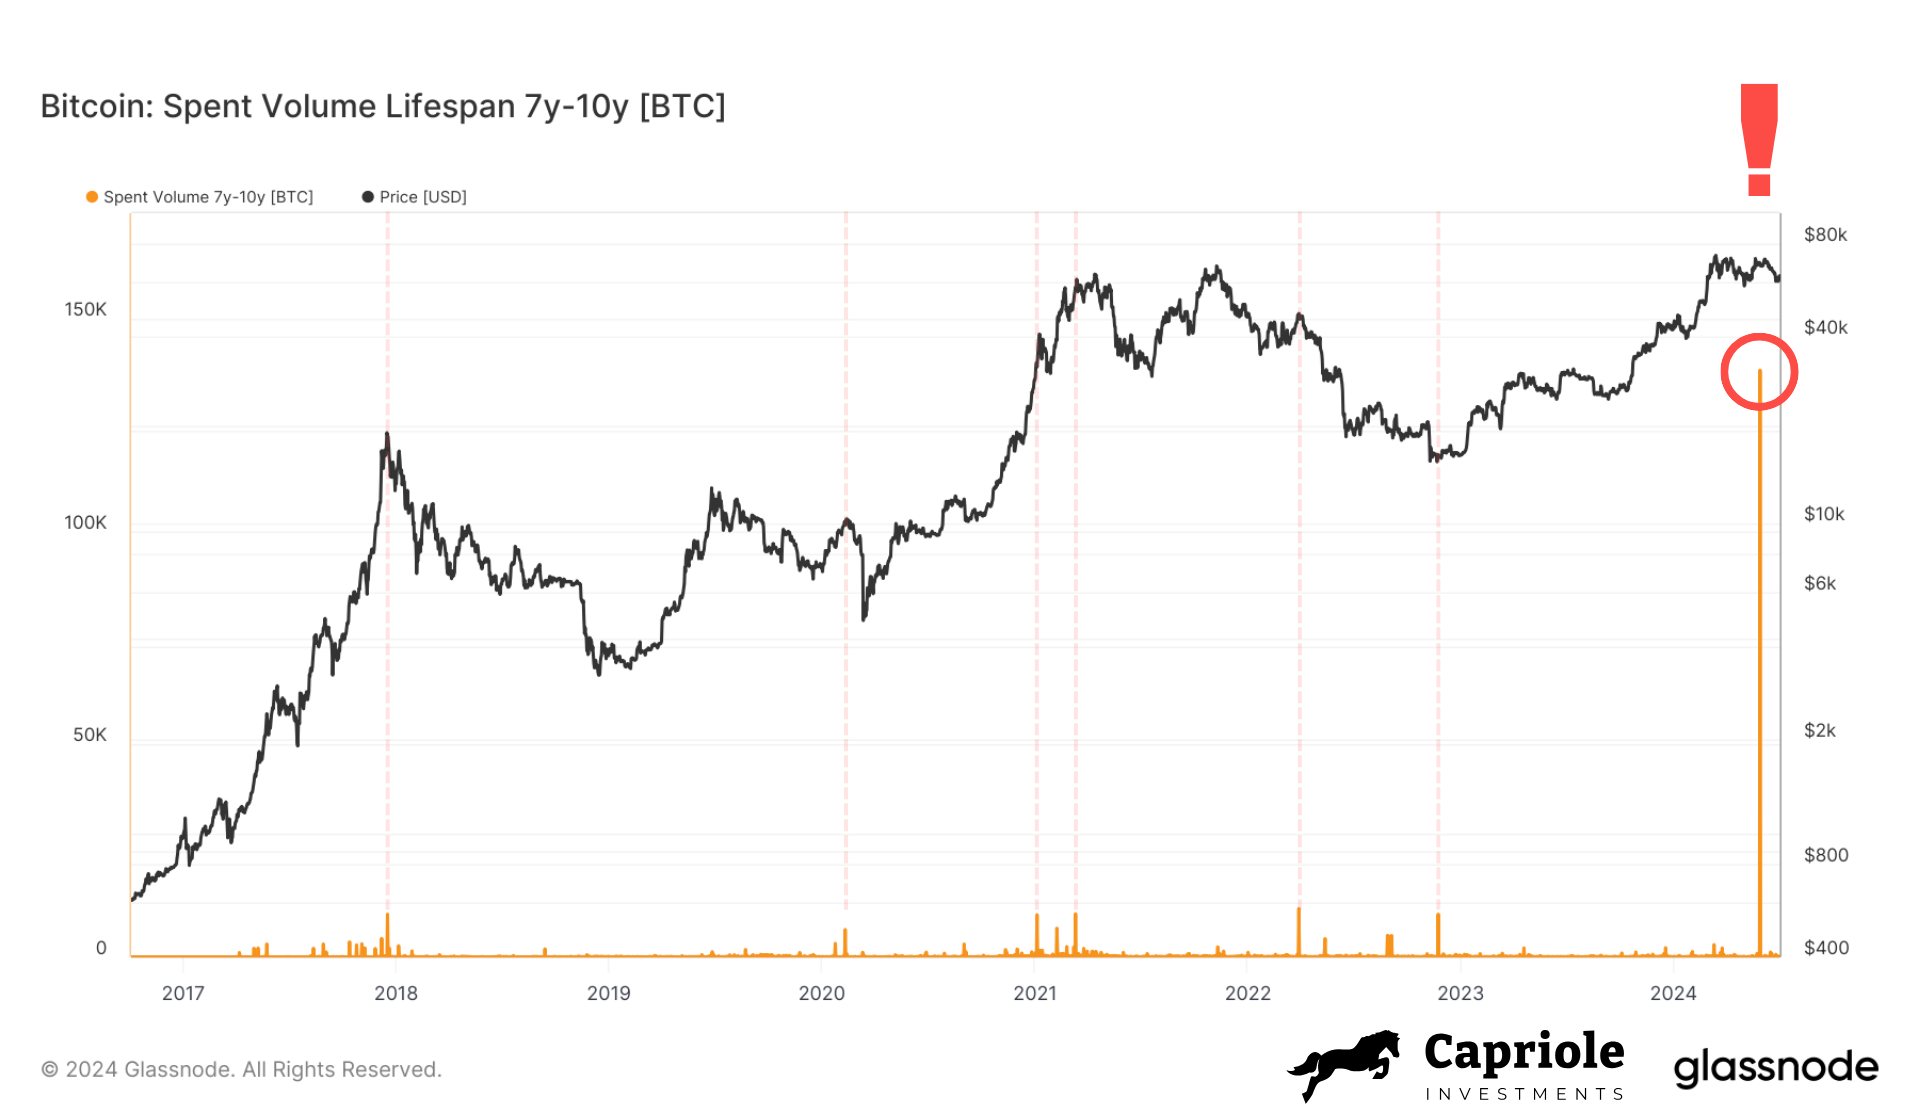
Additionally, spikes in Bitcoin issued volume, especially for coins that are 7 to 10 years old, often signal that a cycle is peaking, due to increasing market risk.


Source: Capriole Investments
Edwards noted a significant increase in Spent Volume in 2024 and described the movement of an unprecedented amount of Bitcoin on-chain as extraordinary.
He also indicated that over $9 billion worth of Bitcoin has been freed from inactive accounts that are over a decade old, largely related to the settlement activities of the defunct Mt. Gox exchange.
Cycle top in: Are traders aware?
While Charles Edwards highlighted potential weaknesses in Bitcoin’s price, it is wise to consider other perspectives as well.
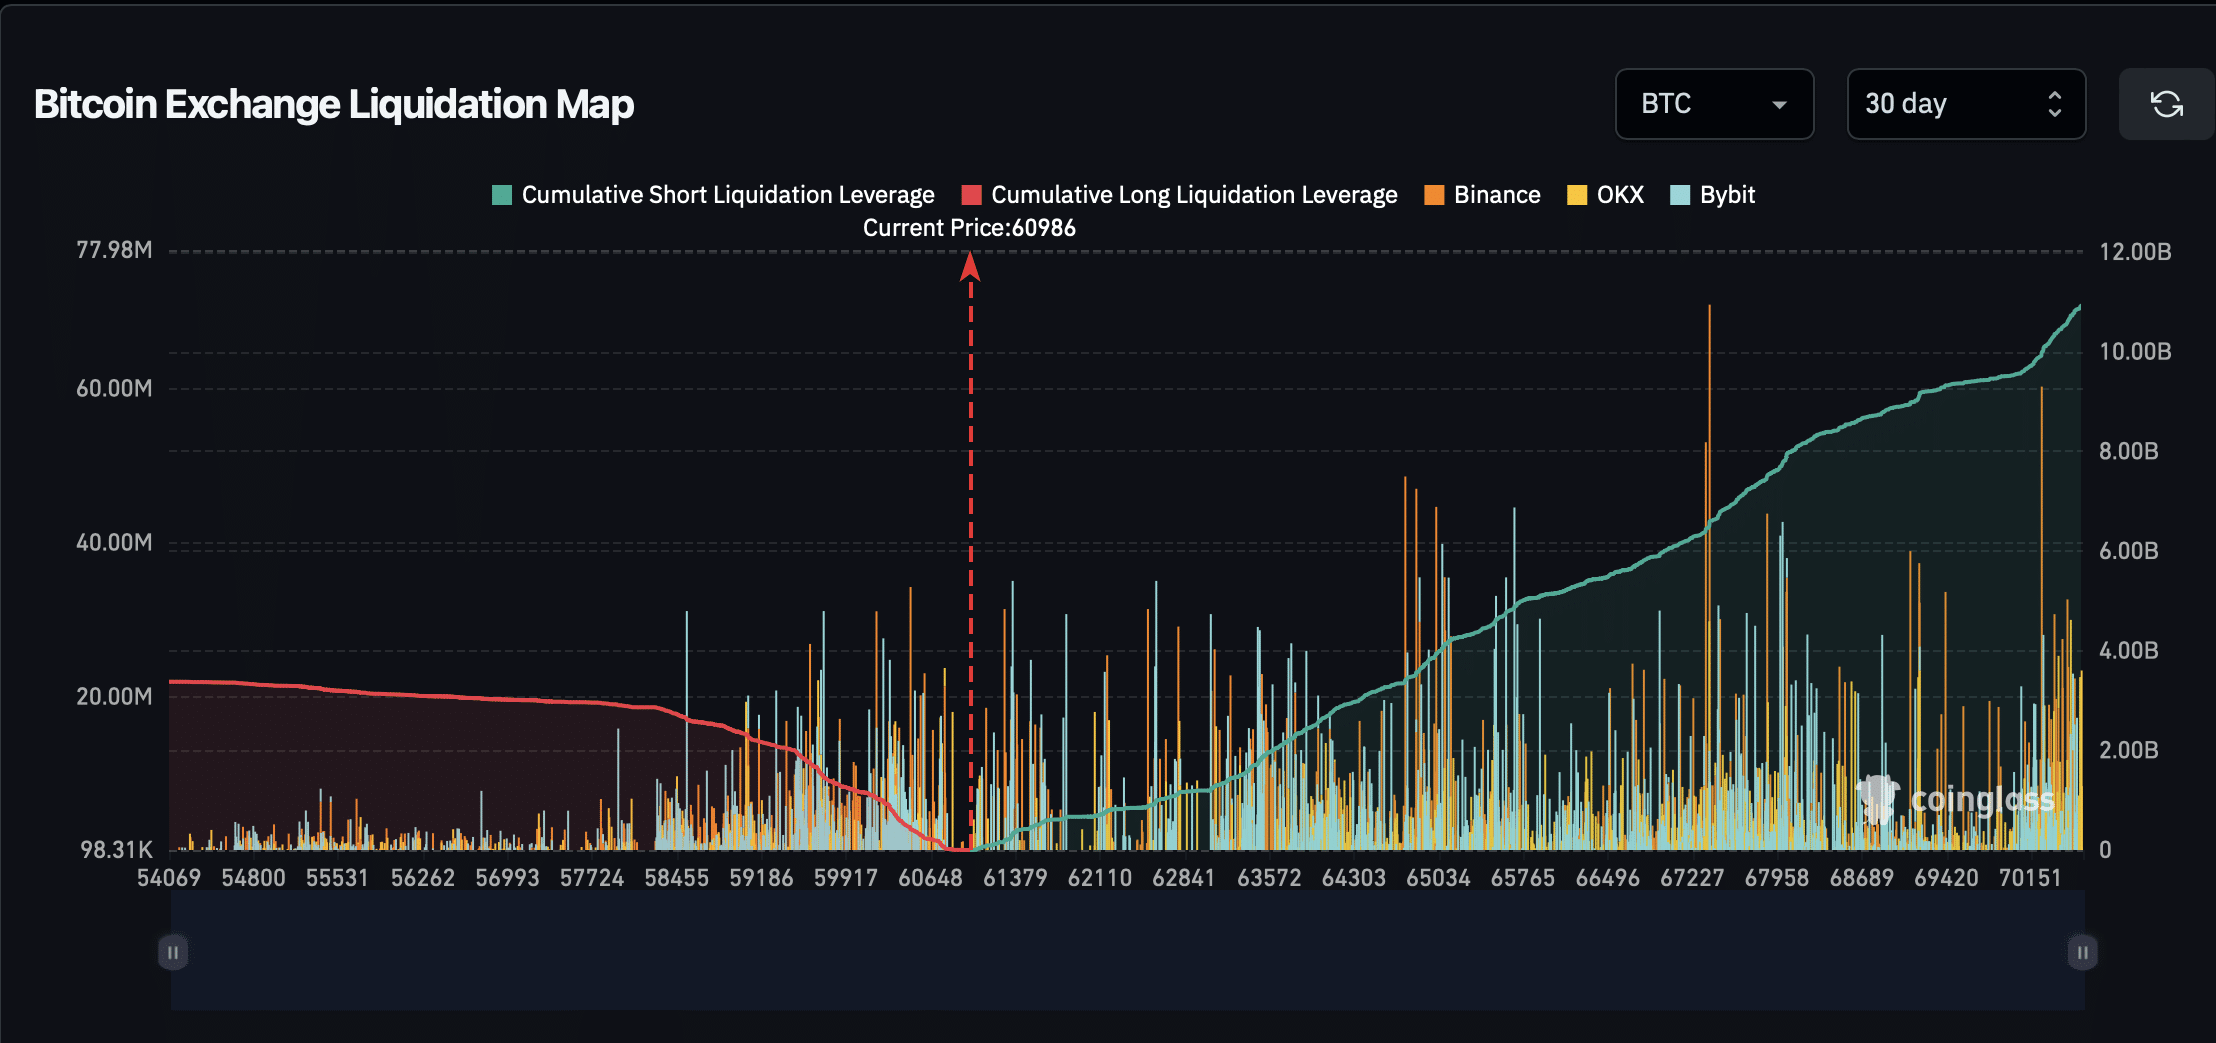
Analysis of BTC short and long liquidation leverage on Coinglass, facts revealed that the majority of liquidations over the past 30 days involved long positions, indicating that many traders are expecting a rise in Bitcoin’s value.


Source: Coinglass
Whether these long positions will prove profitable for traders or whether the price of Bitcoin will continue to decline, as Edwards suggests, only time can tell.
Read Bitcoin’s [BTC] Price Prediction 2024-25
Meanwhile, in terms of the direction the price is moving, the recent report from AMBCrypto suggested in the event of a positive shift in mining activity.
In particular, there has been a noticeable increase in miners’ reserves, which could potentially drive up the price of Bitcoin.
